
CMA data is the set of financial statements a bank asks for before it sanctions or renews a working capital limit, and often a term loan too. If you run a small or medium business and have applied for a cash credit (CC) or overdraft limit, you have probably been asked for “CMA”. This guide explains what CMA data is, what each of its six forms shows, how the bank uses it to decide your limit, and the mistakes that most often get a proposal sent back.
A banker reads a CMA mainly for consistency: do the past figures match your audited accounts and tax filings, and do the projections follow sensibly from the past? A CMA that answers those questions clearly is much easier to approve.
What is CMA data? (CMA full form)
CMA stands for Credit Monitoring Arrangement. The name comes from an old RBI reporting system, but banks still use its format because it puts a business’s past, present and expected finances side by side in a standard layout.
A typical CMA covers:
- Actuals for the last two or three years, taken from your audited financial statements;
- Estimates for the current year;
- Projections for the next year, or for the whole repayment period if you are also asking for a term loan.
The exact number of years and the format details vary from bank to bank, so always ask your branch what it needs.
When does a bank ask for CMA data?
Banks ask for CMA data mainly when assessing a working capital limit, such as a cash credit or overdraft, and when the size of the limit calls for a detailed assessment. For smaller limits to micro and small units, banks often use the simpler turnover method instead. The RBI’s guidance, based on the Nayak Committee, is that working capital limits for small units are computed “on the basis of minimum 20% of their estimated turnover up to credit limit of Rs.5 crore”.
Even where the turnover method applies, many banks still ask for CMA data so they can check repayment capacity, ratios and trends. The amount above which a full CMA becomes mandatory is set by each bank’s own policy.
The six forms of CMA data
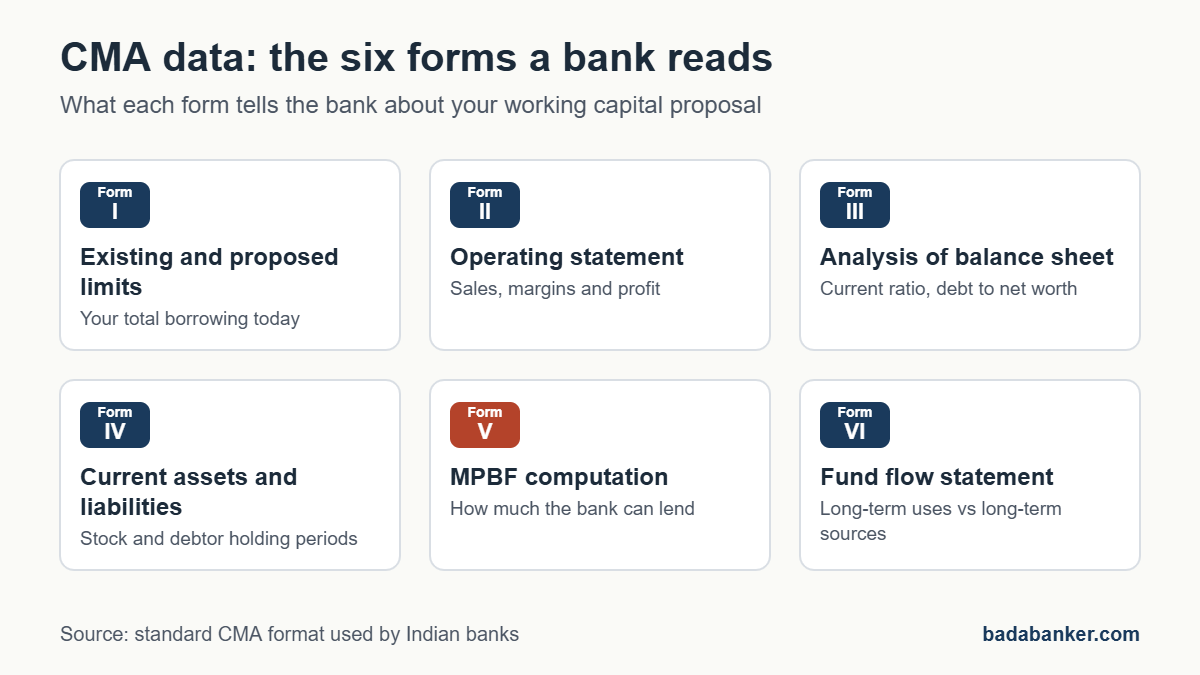
The standard CMA format has six forms. Each answers a different question for the bank.
Form I: Particulars of existing and proposed limits
A summary of every credit facility you have now, from all banks and lenders, and the limits you are asking for. The bank uses it to see your total borrowing and whether you are already overextended.
Form II: Operating statement
Your profit and loss in the CMA layout: sales, cost of sales, operating expenses, interest, depreciation, tax and net profit, year by year. The bank checks whether sales growth is realistic and whether margins are steady or drifting.
Form III: Analysis of balance sheet
Your balance sheet regrouped into current liabilities, term liabilities, net worth, current assets and fixed assets. Term loan instalments falling due within the next twelve months are shown as current liabilities. From this form the bank calculates key ratios such as the current ratio and the debt to net worth ratio.
Form IV: Comparative statement of current assets and current liabilities
The detail behind your working capital: raw material, work in progress, finished goods, receivables and creditors, each also expressed as a holding period in days or months. This is where the bank checks whether you are holding too much stock or giving customers too much credit.
Form V: Computation of maximum permissible bank finance (MPBF)
The calculation of how much working capital the bank can finance, and how much must come from your own funds as margin. The methods are explained in the next section.
Form VI: Fund flow statement
Where long-term money came from and where it went. The bank uses it to check that long-term uses, such as buying machinery or repaying a term loan, are funded by long-term sources and not by diverting working capital.
How the bank calculates your working capital limit
Three methods are in common use. Your bank decides which one applies to your case.
- Turnover method (Nayak Committee). Working capital need is taken as 25% of projected annual turnover. You bring 5% of turnover as margin, and the bank finances at least 20%.
- MPBF method I (Tandon Committee). The bank finances 75% of the working capital gap. The working capital gap is current assets minus current liabilities other than bank borrowings.
- MPBF method II (Tandon Committee). The bank finances 75% of current assets, minus current liabilities other than bank borrowings. You fund 25% of current assets from long-term sources, which builds in a current ratio of at least 1.33.
Worked example
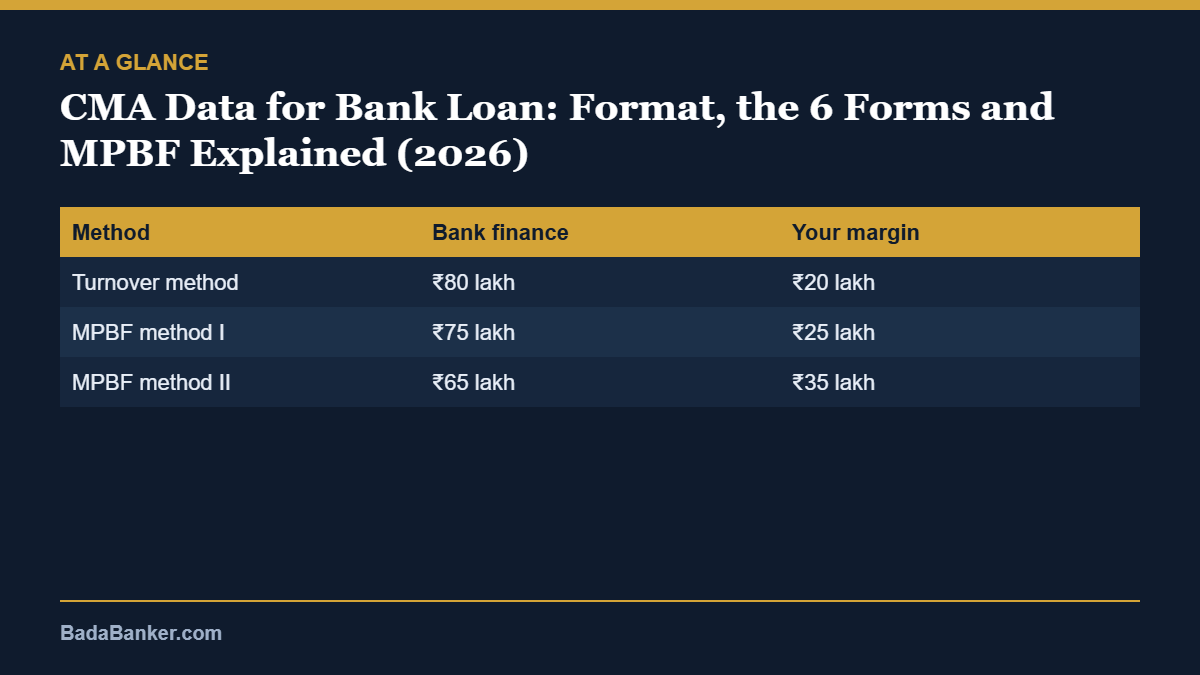
Take a business with projected turnover of ₹400 lakh. Its projected current assets are ₹140 lakh: stock of ₹70 lakh, receivables of ₹60 lakh and other current assets of ₹10 lakh. Its current liabilities other than bank borrowings, mainly trade creditors, are ₹40 lakh. So the working capital gap is ₹100 lakh.
| Method | Bank finance | Your margin |
|---|---|---|
| Turnover method | ₹80 lakh | ₹20 lakh |
| MPBF method I | ₹75 lakh | ₹25 lakh |
| MPBF method II | ₹65 lakh | ₹35 lakh |
Under method II, the current ratio works out to 1.33 (₹140 lakh of current assets against ₹40 lakh of creditors plus ₹65 lakh of bank finance). Under method I it is 1.22. Same business, same numbers, but the limit differs by ₹15 lakh depending on the method, which is why it pays to know which one your bank will use before you plan your margin.
You can try your own figures with our MSME working capital calculator, which covers the turnover method, both MPBF methods and DSCR.
Ratios the bank checks in your CMA
- Current ratio: current assets divided by current liabilities. Under MPBF method II the expected minimum is 1.33.
- Debt to net worth (TOL/TNW): how much of the business is funded by outsiders compared with the owners.
- DSCR (debt service coverage ratio): whether cash profits comfortably cover loan instalments and interest. It matters most for term loans. See our DSCR ratio guide for the formula and a worked example.
- Holding periods: how many days of stock and receivables you carry. A sudden jump or fall in projections needs a reason.
- Sales growth and margins: projections far above past growth, with no orders or capacity to back them, are the most common reason a CMA is questioned.
Each bank sets its own benchmarks for these ratios, so treat them as the questions the bank will ask, not as fixed pass marks.
Common CMA mistakes that delay a loan
- Actuals that don’t match the audited accounts. The past-year figures in the CMA must tie exactly to your audited balance sheet and profit and loss.
- Sales that don’t match GST returns or ITRs. Banks cross-check turnover against your filings.
- Projections with no basis. A jump from 10% growth to 40% needs evidence such as orders in hand, new capacity or a new customer.
- Holding periods that suddenly improve. Showing stock falling from 90 days to 30 days to justify a lower margin, without explaining how, raises a flag.
- Leaving out term loan instalments due within a year from current liabilities, which flatters the current ratio.
- Stock statements that tell a different story. Once a limit is running, the monthly stock statements you file should be consistent with what your CMA projected.
Documents you need to prepare CMA data
- audited financial statements for the last two or three years;
- income tax returns for the same years;
- GST returns for the current year;
- provisional figures for the current year to date;
- recent stock and receivables statements, if you already have a limit;
- sanction letters for your existing loans;
- the basis for your projections, such as order copies, new contracts or capacity details.
Need your CMA data prepared?
BadaBanker prepares CMA data and project reports for MSME loan proposals, checked the way a bank’s credit team will read them. A ready-to-use CMA Excel template is also available to buy.
Email msmebanktool@gmail.com with your loan amount, type of limit and business details. Please don’t send account numbers, passwords or OTPs.
Frequently asked questions
What is the full form of CMA in banking?
CMA stands for Credit Monitoring Arrangement. In practice, “CMA data” or a “CMA report” means the set of six financial forms a bank uses to assess working capital and term loan proposals.
What is the difference between CMA data and a project report?
A project report describes a new project or expansion: what you will set up, what it costs, how it is funded and how it will repay. CMA data is a standard financial format, mostly used to assess working capital for an existing business. A term loan proposal for a new project often needs both. Our guide to the project report for bank loan explains what goes into one.
How many years of projections are needed?
For a working capital limit, banks usually want the current year’s estimate and the next year’s projection. For a term loan, they usually want projections covering the repayment period. Check with your bank, because requirements vary.
Can I prepare CMA data myself?
You can, if you understand the format and your figures well, but the numbers must tie to your audited accounts and filings, and the projections must be defensible. Many businesses use a chartered accountant or a consultant. If your bank asks for CA-certified financials, a chartered accountant must sign them.
Does a CMA guarantee loan approval?
No. A well-prepared CMA makes your proposal easier to assess, but the decision depends on the bank’s appraisal of your business, credit history, security and its own policy.
Related reading
- Cash credit vs overdraft: differences, interest and which to choose
- Stock statement format and drawing power calculation
- MSME Working Capital Calculator 2026 — Nayak Method, Tandon Method, DSCR, Interest Subvention
- MSME Recovery Fund 2026 — Complete Banker’s Guide for Indian Small Business Owners
- CIBIL Score for Business Loans — Complete MSME Banker’s Guide 2026
Sources
- RBI, Frequently Asked Questions on Micro, Small and Medium Enterprises (working capital computation for small units, Q.7)
- Report of the Study Group to Frame Guidelines for Follow-up of Bank Credit (Tandon Committee), 1975: methods of lending
- Report of the Committee to Examine the Adequacy of Institutional Credit to the SSI Sector (Nayak Committee), 1992: turnover method
This guide explains how banks commonly assess working capital. It is general information, not advice for your specific case. Your bank’s own policy and appraisal decide your limit.